The Juniper WLC wireless controllers use a simple GUI that is normally sufficient for management tasks. There are occasions when using the CMD line is necessary. This is a short list that I'll update from time-to-time.
Functions:
- Syslog:
set log server x.x.x.x port 514 severity warning
This post provides a quick walk
through on how to enable a Dell server to interact with the OME.
Problem:
- Add\Manage servers through OME.
- Server displayed as unknown or does not return
inventory data after SNMP was enabled and OMSA is installed on server.
Solution:
OME is used to
monitor server SMNP status and to provide firmware updates. It’s a handy server as it provides email
alerts for things like power cycles and predictive drive failures. Adding a server to OME is a straight-forward
process but in order for the server to interact with OME, the monitored servers must be properly
configured. The following are the
necessary configuration steps:
1.
Install
the OMSA client on the server in order to retrieve the server health from the
OME server.
2.
Enable and configure SNMP on the server that
will be monitored. Enable the community
on the “Security” tab for monitoring. Be
sure to configure the “Traps” tab to forward alerts to OEM.
3.
Create AD user account to monitor WMI. This user does not need administrative
privileges. Edit WMI properties to provide
the new AD user monitor privileges.
Administrative
Tools → Computer Management → Services and Applications → right click “WMI
Control” → properties →security tab → highlight “Root” → click security button →
add the monitoring user account → allow “Remote Enable”.
Make sure WMI is
allowed through the Windows firewall. I recommended
only allowing access from specific servers (e.g. OME).
4.
Configure
DCOM Security to allow user access.
Start →
Run → type “DCOMCNFG” → click OK → expand
Component Services → expand computers → right-click My Computer → click
Properties → COM Security tab → click Edit Limits under the Launch and Activation
Permissions → add the AD user account created for the WMI monitor → allow the
user Remote Launch permission → click OK.
At this point the server will be
able to interact with the OME server.
References:
Last updated 11/27/12 by Steven Jordan
I was unable to collect flow data with Foglight on the Hyper-V guest I was
working with. I thought I had everything
set up right but I was missing data.
I enabled port mirroring on the switch port that connected to the router
(source) and copied the data to an extra NIC (destination) on my Hyper-V
server.
I installed the Quest/ Foglight agent (PTflow) and added the NIC with the
mirrored data to a guest. After I enabled the PTflow traffic monitoring on the
new NIC I was able to get some traffic flow data; but a lot was either missing,
or showed up only as TCP 5053, or TCP 5054 traffic.
I was unable to find a straight answer on the Internet however I did find
some people were experiencing similar problems with Wire Shark.
The problem was specific to Hyper-V guests. The virtual NICs are unable to
run in promiscuous mode which is necessary to view all traffic data. I began to monitor the PTFlow from the host,
rather than the guest, and a wealth of information began to populate.
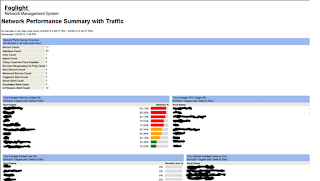
I've been looking into monitoring alternatives to Solarwinds. I am a big fan of Solarwinds but I don't like their super expensive licensing. I have recently discovered Quest's Foglight Network Management System and I am excited with what I've seen so far.
The most exciting thing about Foglight is their starting licensing agreement. Quest has made their product 100% free for the 1st 100 devices. 100 devices is unheard of for the quality and sophistication of the product. I've seen full product giveaways that limit the user count to 5, or 10 (i.e. Citrix) but 100 is borderline practical. This is something a small business can immediately implement and benefit without spending a dime.
Solarwinds Orion Network Performance Monitor provides a 150 device license. If I remember correctly the price was around $2500 for Orion, and an additional 25% per year, for the ongoing maintenance and software assurance. What's more is if you want to expand Solarwinds' functional use expect to pay more. Their netflow add-on was an additional $2500 for the 150 device license. If I wanted to monitor application services like Exchange, AD, or SQL, I had to shell out another $2500. The Solarwinds Engineer Toolkit was another $1500 and their Switch Port Mapper was another $1500. That's almost at $10,000 for only a 150 user device license.
Quest's Foglight had incorporated all of the above mentioned services as part of their base monitoring product. Netflow, SNMP, Application Monitor, and their Tool Suite are included with the 100 user license.
I spoke with someone from Quest regarding their pricing structure beyond the 1st 100 devices. As more devices are added it quickly gets expensive. $100 per device over 100 devices. 150 devices will cost $5,000. They drop the price to $49 per device, beyond 100, after you purchase 500 device licenses. 500 devices will cost $19,600 so that puts them more in line with Solarwinds. Don't forget the 100 free device licenses!

Is Quest Foglight as good as Solarwinds Orion, Netflow, APM, etc..? Almost. From what I've seen so far the two offer very similar services. Orion is more intuitive and beats Foglight on aesthetics. Unless someone is familiar with Foglight they may have trouble pulling the right report. If price wasn't the only factor, and I was looking for a product to use on a larger network, I may still recommend Solarwinds. If a smaller network can get by with monitoring less than 100 devices (I suspect there are many out there) Foglight wins hands down.
1 more thing- I definetly plan to use this as my home monitoring solution.
http://www.quest.com/foglight-network-management-system/
Trying to get a Fortigate, and Solarwinds' Netflow to work together is trouble. We can configure S-Flow (see previous post) on the Fortigate and Solarwinds will accept the feed; however the SW output from is not correct. Some issues:
- The traffic distribution by percent looks like it may be accurate.
- The actual numbers for traffic flow are way off.
- The actual monitored ports are mislabeled in the Solarwinds' Netflow page.
Let's say I monitor my Fortigate's port 1 & 2, with Orion NPM. The SNMP statistics and numbers are accurate and display well.
If I try to monitor the same ports from SW-Netflow there will be no information. After trial and error, I found I was able to get port 1 & 2's sflow data, if I configured SW-Netflow, to collect information from the Fortigate port 7&9.
Keep in mind, there is nothing physically plugged into port 7&9. I figured out that the data matched up to the 1st two ports on the Fortigate. I have a hard time explaining the results to my co-workers. Luckily they don't have as much interest in SW as I do. It's far from perfect but it is still helpful. Hopefully SW will fix this in future releases.
The only other options are to rely on the FortiAnalyzer for additional data or to use an open source sflow solution, specifically for our Fortigates.
Last updated 1/17/12 by Steven Jordan.
Config sample to enable S-Flow with SolarWinds:
sflow agent ip x.x.x.x
sflow collector ip x.x.x.x port 2055
sflow interval 60
interface GigabitEthernet1/0/2
broadcast-suppression pps 3000
undo jumboframe enable
stp disable
stp edged-port enable
sflow enable inbound
sflow enable outbound
sflow sampling-rate 1000
Last updated 9/7/11 by Steven Jordan
Problem:
Enable and configure S-Flow on a Fortigate firewall. Send samples to S-flow collector (e.g., Solarwinds Netflow).
Solution:
Configuration steps to enable S-Flow on a Fortigate 200B for use with the Solarwinds Netflow collector:
FG200xxx (interface) #config system sflow
FG200xxx (interface) #set collector-ip x.x.x.x
FG200xxx (interface) #set collector-port 2055
FG200xxx (interface) #end
FG200Bxxx (interface) # config sys interface
FG200Bxxx (interface) #edit
|
FG200Bxxx (portx) # set sflow-sampler enable
FG200Bxxx(portx) # set sample-rate 1000
FG200Bxxx (portx) # set sample-direction both
FG200Bxxx (portx) # set polling-interval 20
FG200xxx (portx) # next
FG200xxx (portx) # end
|
|


